


[Mou Zhou Ji] The Worst Non-Farm Payrolls, The Best Earnings Report: Which Should We Trust? (Week 32 of 2026 | Issue No. 281)
In 1811, weavers in Nottingham, UK, stormed factories and smashed machines with hammers. The machines had taken away their livelihoods, and this group later became known as the Luddites.
The workers were not mistaken about the facts; manual weaving positions were indeed disappearing. But smashing machines couldn't stop the machines. Over the next twenty years, the number of weavers continued to decline, while Britain's cotton textile production actually multiplied several times over: one machine operator could now replace dozens of people, driving down the cost and price of cloth. Orders from around the world flooded into Britain. Jobs were vanishing, yet output and profits were surging—these two phenomena appeared simultaneously for the first time in history at the turning point where machinery replaced human labor.
This week's US economy presents the exact same scenario.
I. A Textbook Recession Signal
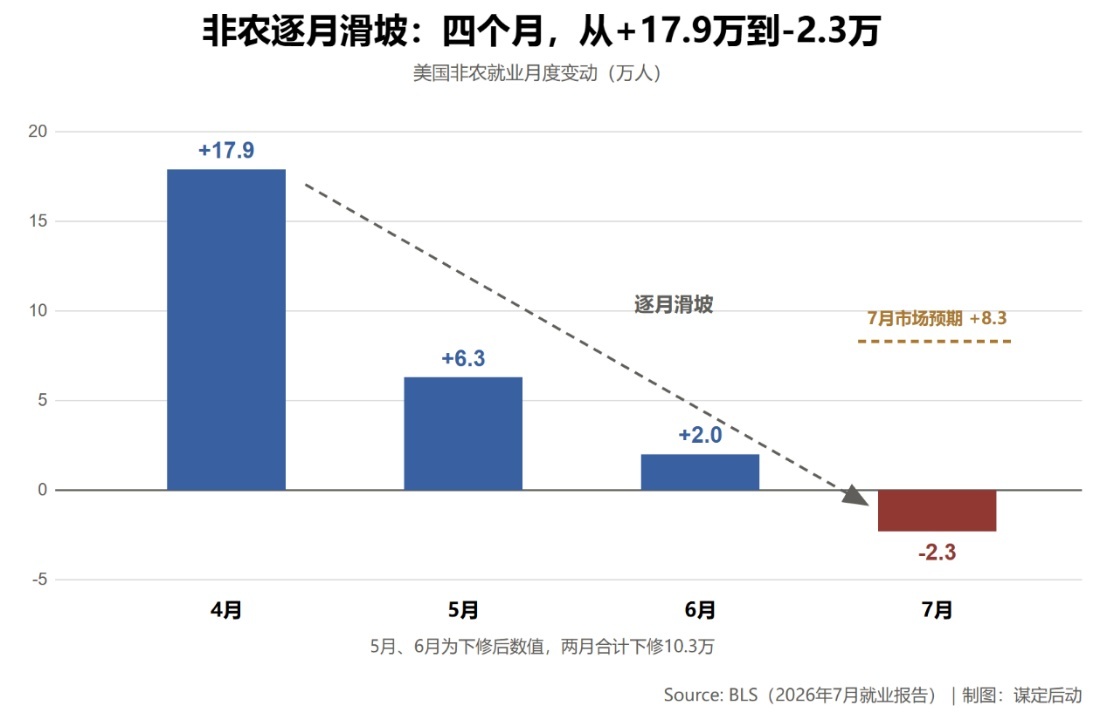
Let's look at the bad news first. The July non-farm payrolls released on Friday shattered market expectations: forecasts called for an increase of 83,000, but the actual figure showed a decrease of 23,000.
Zooming out, the trajectory over the past four months is clear: April +179,000, May +63,000, June +20,000, July -23,000—a steady decline (see Figure 1). Moreover, the data for May and June were revised downward by a combined 103,000, meaning the actual slope was steeper than initially observed.
The details are equally unappealing. The government sector shed 53,000 jobs, acting as the largest drag, while retail and leisure/hospitality sectors also contracted. The unemployment rate stood at 4.1%, dropping 0.1 percentage points from the previous month, but don't be fooled by this number: it fell because the denominator shrank. The labor force participation rate dropped to 61.4%, a five-year low. People weren't finding jobs; they simply stopped looking. Hourly wage growth year-over-year was only 3.2%, the lowest since May 2021.
Placing this data set into any macroeconomic textbook from the past thirty years would lead to the following discussion: earnings revisions downward, recession imminent, sell stocks.
II. Another Data Set Tells a Different Story
Yet, during the same week, as the Q2 earnings season neared its close, 88% of S&P 500 companies had reported, delivering results like this:
· Earnings growth of 50.4%, the highest since Q2 2021
· Net profit margin of 16.9%, the highest value recorded by FactSet since it began tracking in 2009 (see Figure 2)
· 86% of companies beat EPS estimates, also the highest since Q2 2021
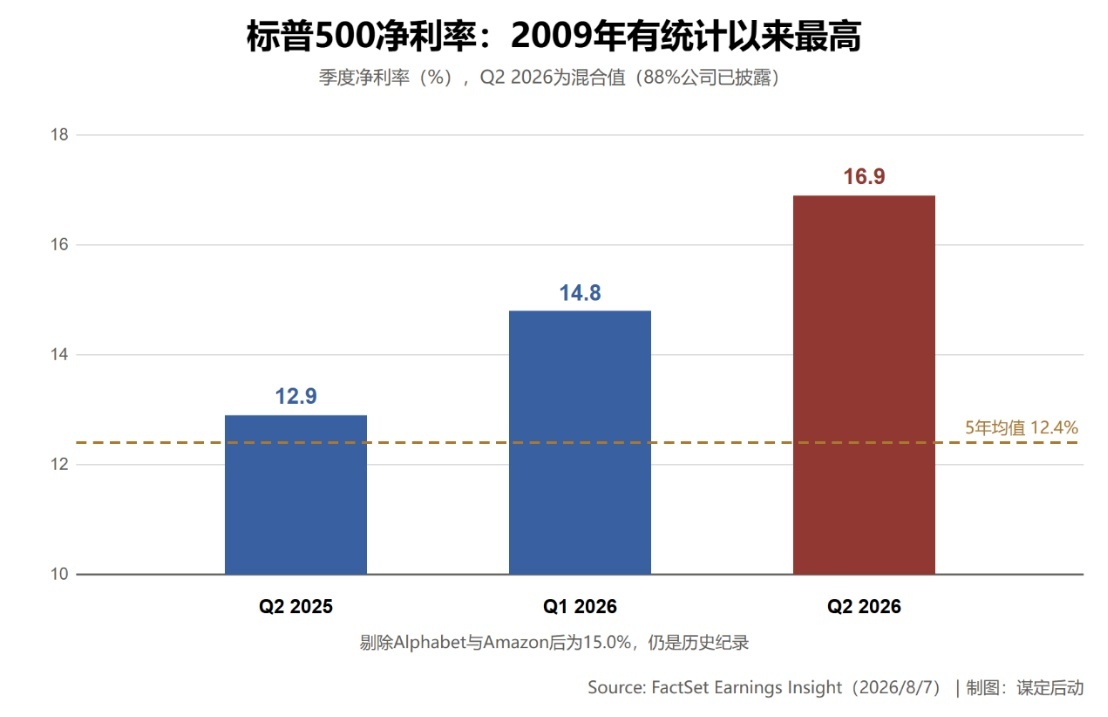
Some might argue that the 50.4% figure is inflated: Alphabet booked $98 billion in equity investment income in a single quarter, and Amazon booked $53.4 billion, largely driven by investments in Anthropic. These two companies accounted for 71% of the index's earnings growth increment since the end of June. This skepticism is valid. However, even if you remove these two entirely, earnings growth remains at 32.0%, and net profit margin stays at 15.0%, which is still a historical record.
After squeezing out the water, the conclusion hasn't changed: the labor market is cooling, while corporate profits are heating up. Under old frameworks, these two events shouldn't happen simultaneously. Either the thermometer is broken, or the weather has changed.
III. The Thermometer Isn't Broken; The Weather Has Changed
To distinguish between these two possibilities, you only need to watch one number: revenue.
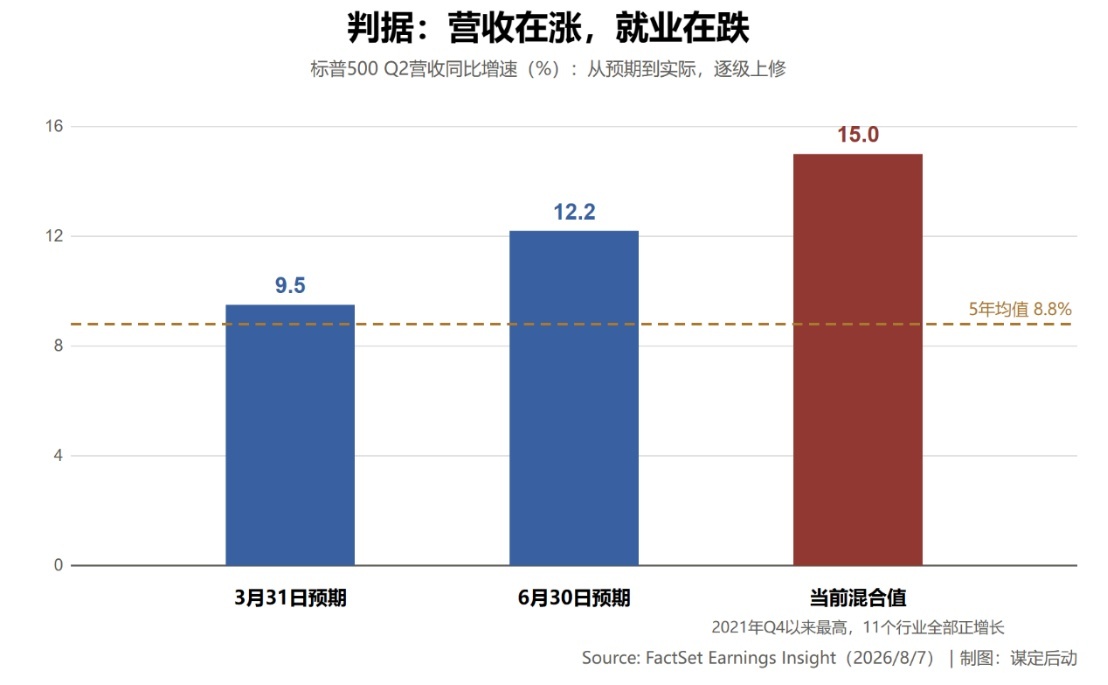
The logic is straightforward. If companies are laying off workers due to lack of business, revenue should fall alongside employment, as happened in 2001 and 2008. However, S&P 500 revenue grew by 15.0% in Q2, the highest since Q4 2021, with all eleven industries showing positive growth (see Figure 3). Business is getting bigger, yet fewer people are being used. This isn't a collapse in demand; this is substitution.
Where does this substitution come from? The AI capital expenditures poured in over the past two years are beginning to shift from cost items to output items in financial reports. For the same amount of revenue, fewer hands are needed; hourly wage growth has dropped to 3.2%, indicating that those remaining have little bargaining power to push up costs. Cooling labor costs are a tailwind for the record net profit margin of 16.9%, not a headwind.
Therefore, the non-farm payroll thermometer isn't broken; what it measures has changed. It used to serve as a thermometer for both the labor market and the overall economy because the two were previously linked. Now, it only serves the former role. Using it to predict corporate earnings is like using weaver unemployment rates in 1815 to short the British textile industry.
IV. The Fed Perspective: Bad Data Is a Pass
For the stock market, this ugly non-farm report has a second layer of value.
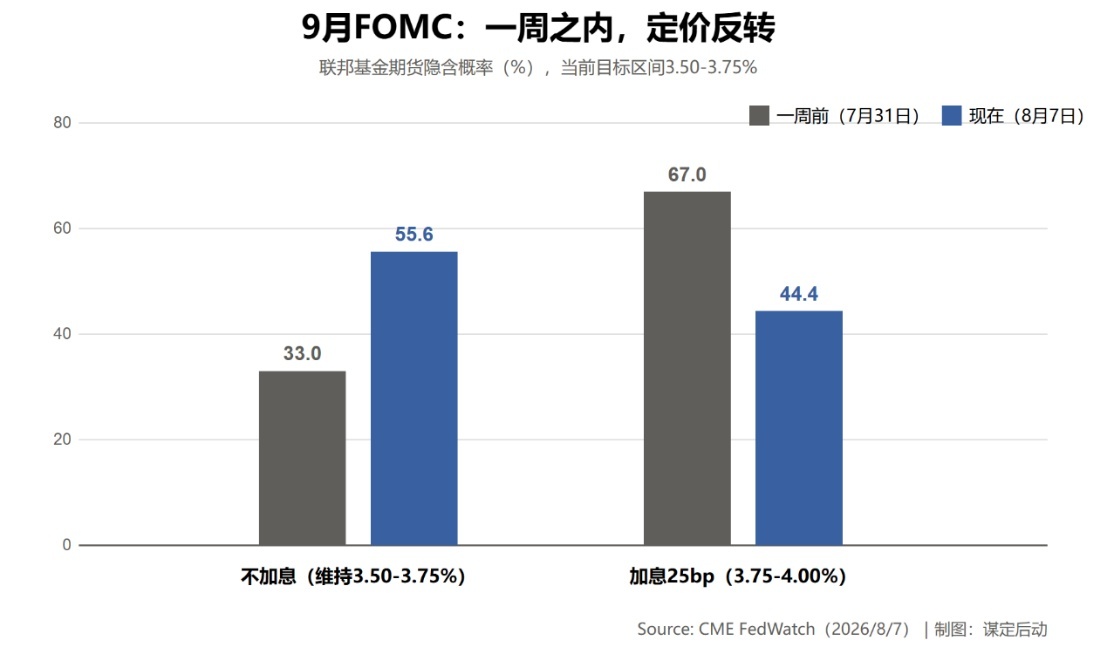
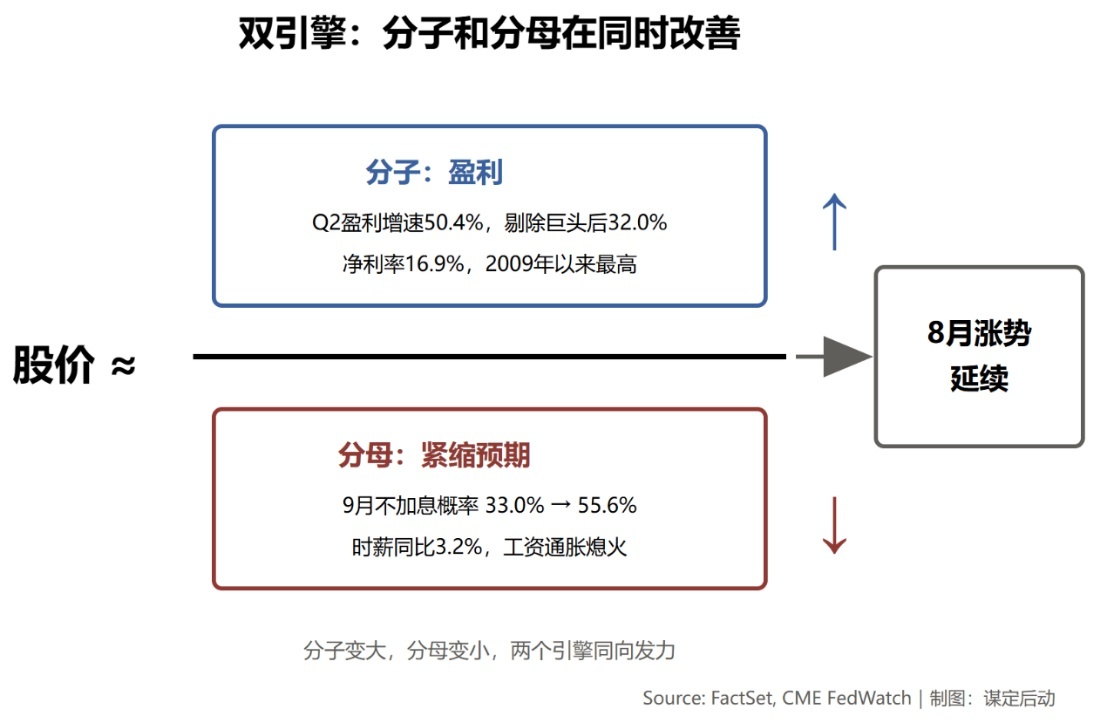
Within a week of the data release, the probability of no rate hike in September on CME FedWatch jumped from 33.0% to 55.6%, while the probability of a 25-basis-point hike dropped from 67.0% to 44.4% (see Figure 4). The market changed its tune with real money: from "one more hike" to "we've reached the peak."
.
What supports this change in view isn't just employment. The 3.2% hourly wage growth has blocked the channel for a wage-price spiral. The phrase "inflation under control" fundamentally relies on wages, not oil prices. Cooling employment and cooling wages mean the tightening cycle has lost its reason to continue.
At this point, the logic for the continuation of August's rally is complete: both the numerator and denominator are improving simultaneously (see Figure 5). On the numerator side, earnings growth is 50.4%, or 32.0% after adjusting for anomalies; on the denominator side, tightening expectations have peaked and are falling back. The "reappearance of peak tightening expectations" repeatedly highlighted in previous issues received dual confirmation from non-farm payrolls and FedWatch this week.
V. When Would This Judgment Be Wrong?
The entire logic rests on revenue as the sole criterion. Deteriorating employment falls into two categories: AI-driven substitution, where revenue continues to rise; or demand contraction, where revenue falls along with it. Current data belongs to the former, but there is no wall between the two. Those leaving the labor market do not receive wages and will inevitably spend less; substitution can slide into contraction.
Three observation points:
1. Retail Sales MoM: If it turns negative for two consecutive months, beware of the demand side. The US Department of Commerce releases last month's data mid-month; the July figure will be visible in mid-August.
2. Credit Card Delinquency Rates: As household cash flow deteriorates, this metric moves first. The fastest gauge isn't bank quarterly reports, but monthly delinquency data disclosed by card issuers like Capital One and Synchrony mid-month, leading official statistics by a quarter.
3. Q3 Earnings Season Revenue Guidance: Companies know best whether orders have changed. For individual stocks, look at earnings calls; at the index level, FactSet provides weekly summaries. Currently, among the 75 companies providing Q3 guidance, the negative proportion is 33%, far below the five-year average of 58%. Companies themselves are not panicking.
Before revenue data breaks key levels, pullbacks caused by recession narratives are errors made by reading new terrain with old maps. Warning of risks does not mean bearishness; pullbacks are buying opportunities.
Data Sources: BLS (July 2026 Employment Report), FactSet Earnings Insight (August 7, 2026), CME FedWatch (August 7, 2026). This article does not constitute investment advice.
The copyright of this article belongs to the original author/organization.
The views expressed herein are solely those of the author and do not reflect the stance of the platform. The content is intended for investment reference purposes only and shall not be considered as investment advice. Please contact us if you have any questions or suggestions regarding the content services provided by the platform.
