
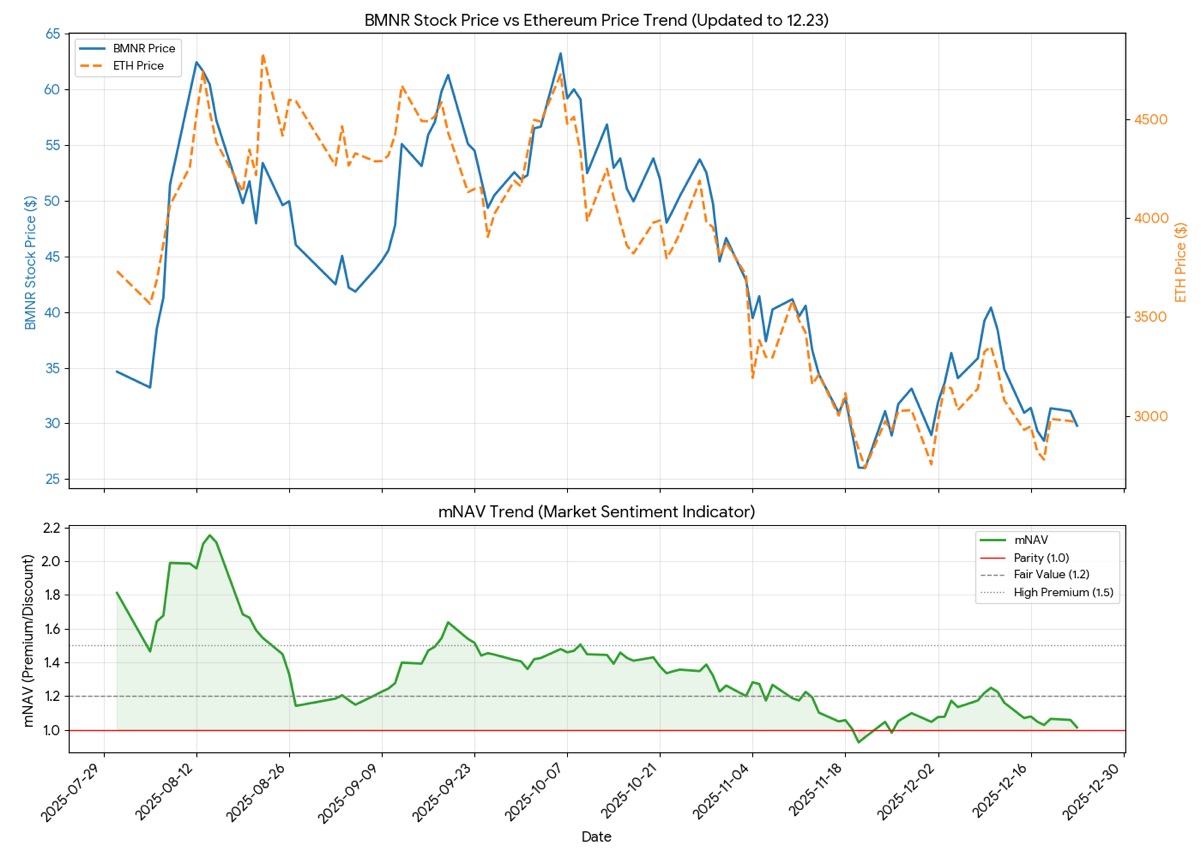
I fed the historical data of the tracking model BMNR to Gemini3 to analyze the correlation trends between BMNR, ETH, and mNAV, resulting in this chart that clearly reflects what happened to BMNR over the past six months. The previous judgment that BMNR's fair premium was around 1.2 was also confirmed in this chart:
1. BMNR vs ETH (Correlation and Beta)
Strong correlation: The blue line (BMNR) and the orange line (ETH) show highly overlapping trends, confirming that BMNR is a high-beta vehicle for ETH.
Elasticity difference: Note in August, the blue line (BMNR) had a significantly steeper rise than ETH. That was the high-premium period (mNAV expansion), where BMNR delivered excess returns.
Recent weakness: In December, the blue line started to look "heavier" than the orange line. When ETH attempted to rebound, BMNR's follow-up rise weakened, corresponding to the contraction in mNAV.
2. mNAV Trend (Sentiment Indicator)
Premium fading: The green line clearly shows a downward channel. From the crazy premium of 2.0 in August, it has now returned to around 1.05.
Key support level: The red line in the chart marks mNAV = 1.0 (Parity). You can see that in the last two weeks (far right), the green line briefly touched or even dipped below this red line before barely recovering.
Fair value pivot: The dotted line marks 1.2 (Fair Value). For most of September to November, mNAV was above 1.2, which was a healthy consolidation range. The current 1.05 is clearly in the undervalued/panic zone.
$BitMine Immersion Tech(BMNR.US)
The copyright of this article belongs to the original author/organization.
The views expressed herein are solely those of the author and do not reflect the stance of the platform. The content is intended for investment reference purposes only and shall not be considered as investment advice. Please contact us if you have any questions or suggestions regarding the content services provided by the platform.
