
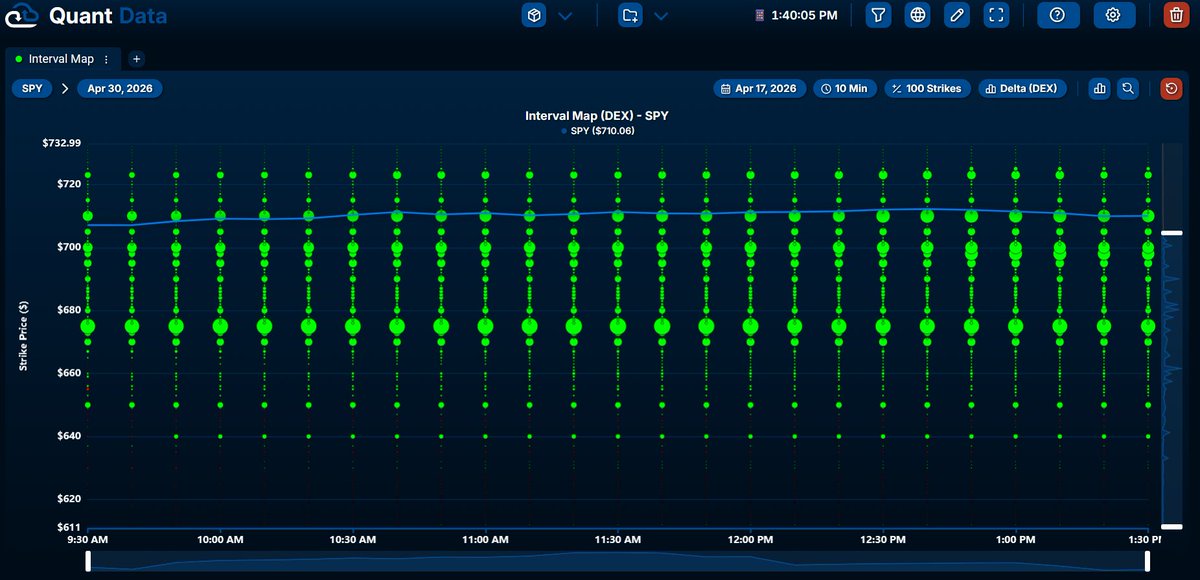
$SPDR S&P 500(SPY.US) @GROK analyze this DEX Interval Map for 4/30 using the trading session data from 4/17. Once this is done, create a visual graphic to detail the summary.
Source: Jim
The copyright of this article belongs to the original author/organization.
The views expressed herein are solely those of the author and do not reflect the stance of the platform. The content is intended for investment reference purposes only and shall not be considered as investment advice. Please contact us if you have any questions or suggestions regarding the content services provided by the platform.
Post your comment

No Comments