


 Likes Received
 Posts
PostsIs $MU's stock price continuing to consolidate? (07/01)
Since I'm currently working on my laptop while out and about, I won't be expanding my work to include recent news summaries or discussions on stock price K-line charts. Let's dive straight into the options data analysis:
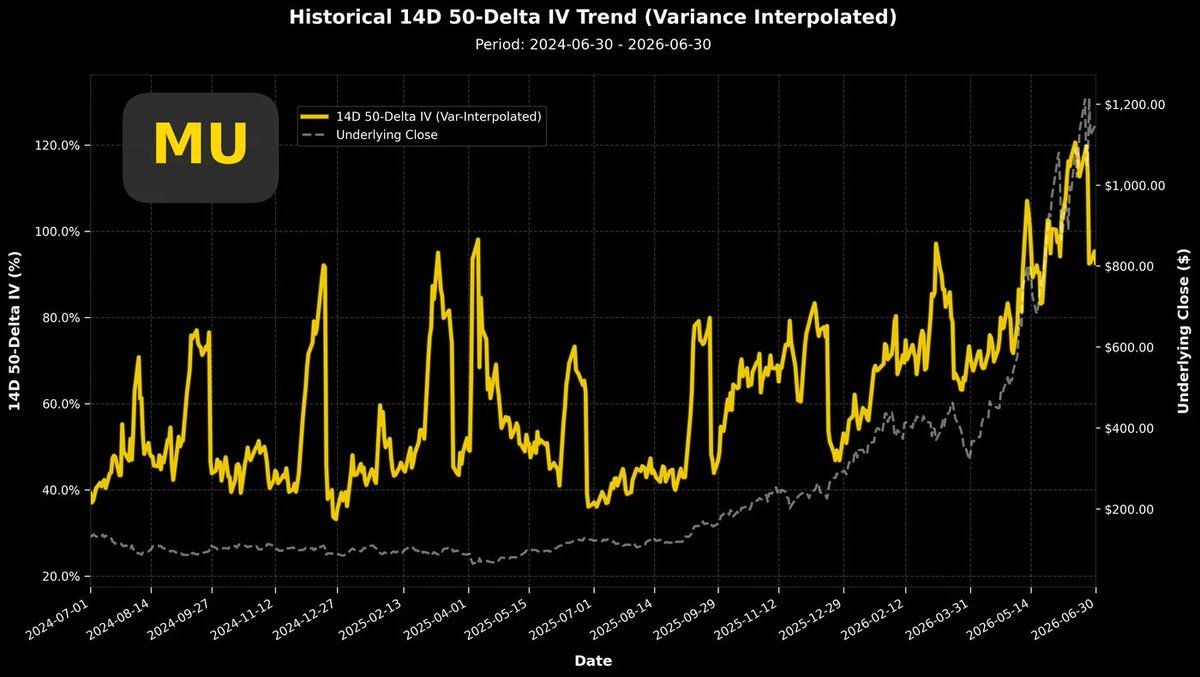
The chart above shows the two-year implied volatility of $Micron Tech(MU.US). Volatility plummeted after the earnings report and is currently at a very low level. The current sequence is very short, making it difficult to discern a trend, but the fact that it has dropped to such a low level seems to suggest that future volatility will no longer increase in a parabolic fashion. If the fundamental pattern changes, the pattern of stock price increases will also no longer be parabolic. $Direxion Daily MU Bull 2X Shares(MUU.US) $GraniteShares 2x Long MU Daily ETF(MULL.US)
It goes without saying that the fundamentals are excellent. Given such strong price action, even if it's likely that the rate of increase won't be the same, I wouldn't easily turn bearish.
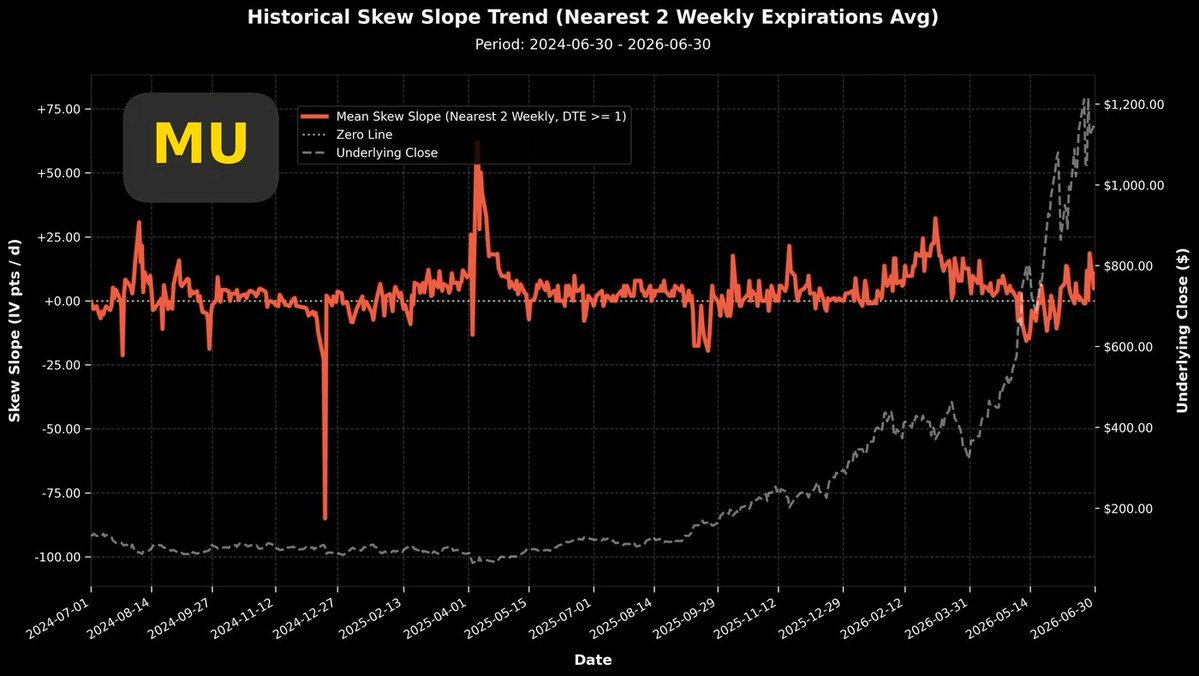
The chart above shows the long-term volatility spread trend for Micron. The pre-earnings price volatility actually helped flush out crowded long positions early. Post-earnings, there hasn't been a crash like we saw with $Oracle(ORCL.US) or $Broadcom(AVGO.US). The volatility spread is still holding above the zero line, which is a positive sign.
If this oscillating uptrend continues, and if we can replicate the situation from early March this year: the stock price consolidating near highs while the volatility spread hits recent highs, it could actually signal the completion of the consolidation phase.
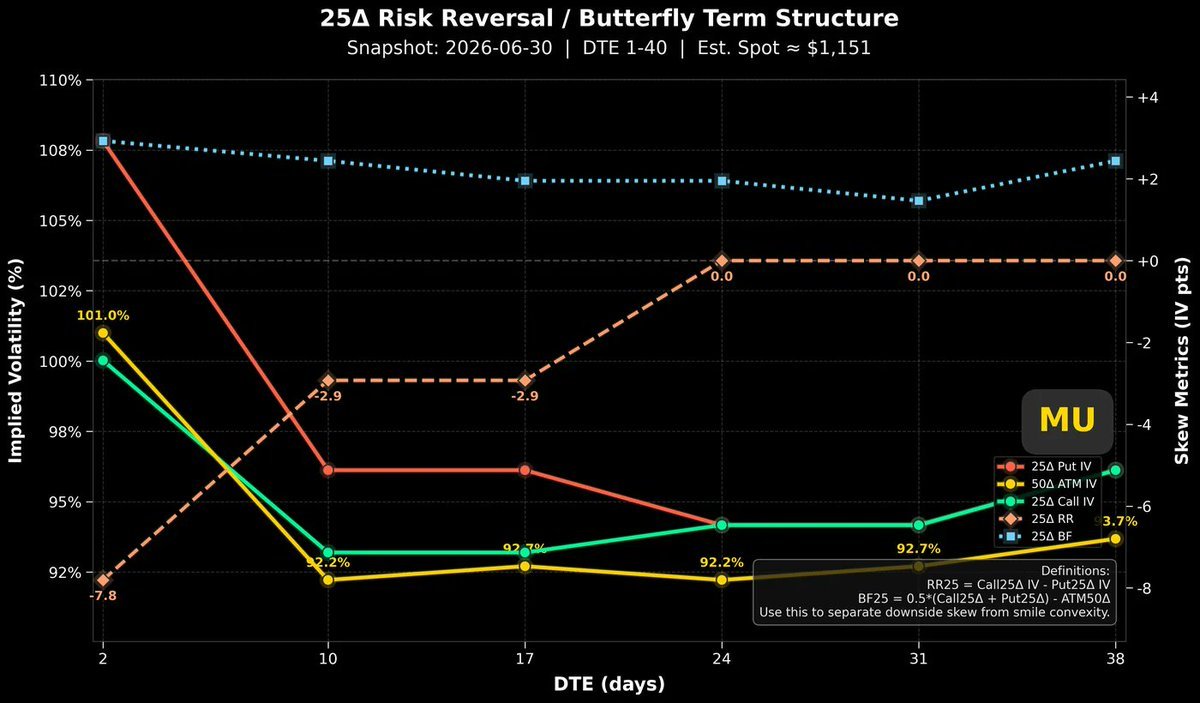
The chart above plots the volatility for all options expiring within the next month.
In this chart, we can see that for options expiring within three weeks,
the volatility of the red line (put options) is significantly higher.
For options expiring in 24 days or more, the red and green lines overlap.
Market participants share a consensus that they must defend against short-term price declines,
while beyond three weeks, the balance between bulls and bears is fairly even with no clear directional bias.
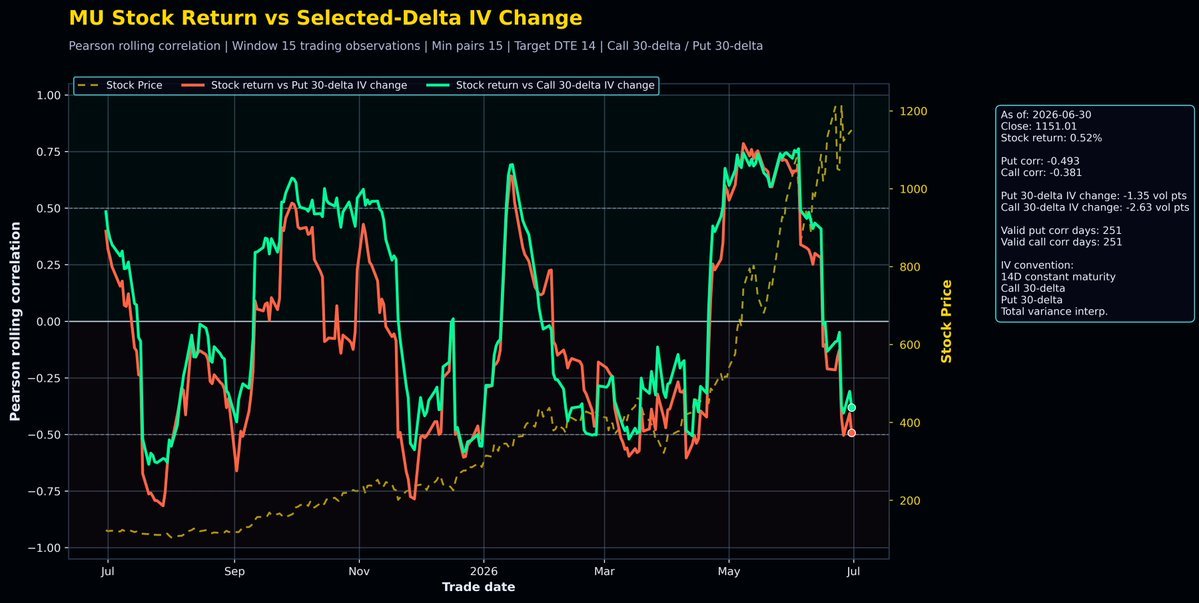
Observing the correlation coefficient between Micron's stock returns and volatility, I have an increasingly strong feeling that the stock price is likely to complete its consolidation within the current high-range oscillation zone (992~1255).
Micron's correlation coefficient started to decline even before the stock price hit new highs, breaking away from the strong positive correlation level (+0.75). During the decline of the correlation coefficient, the stock price did not show significant drops.
This situation has persisted for a while now, and the correlation coefficient has safely landed at the meaningful level of -0.5. Based on the current data, it looks more and more like the situation from early March this year.
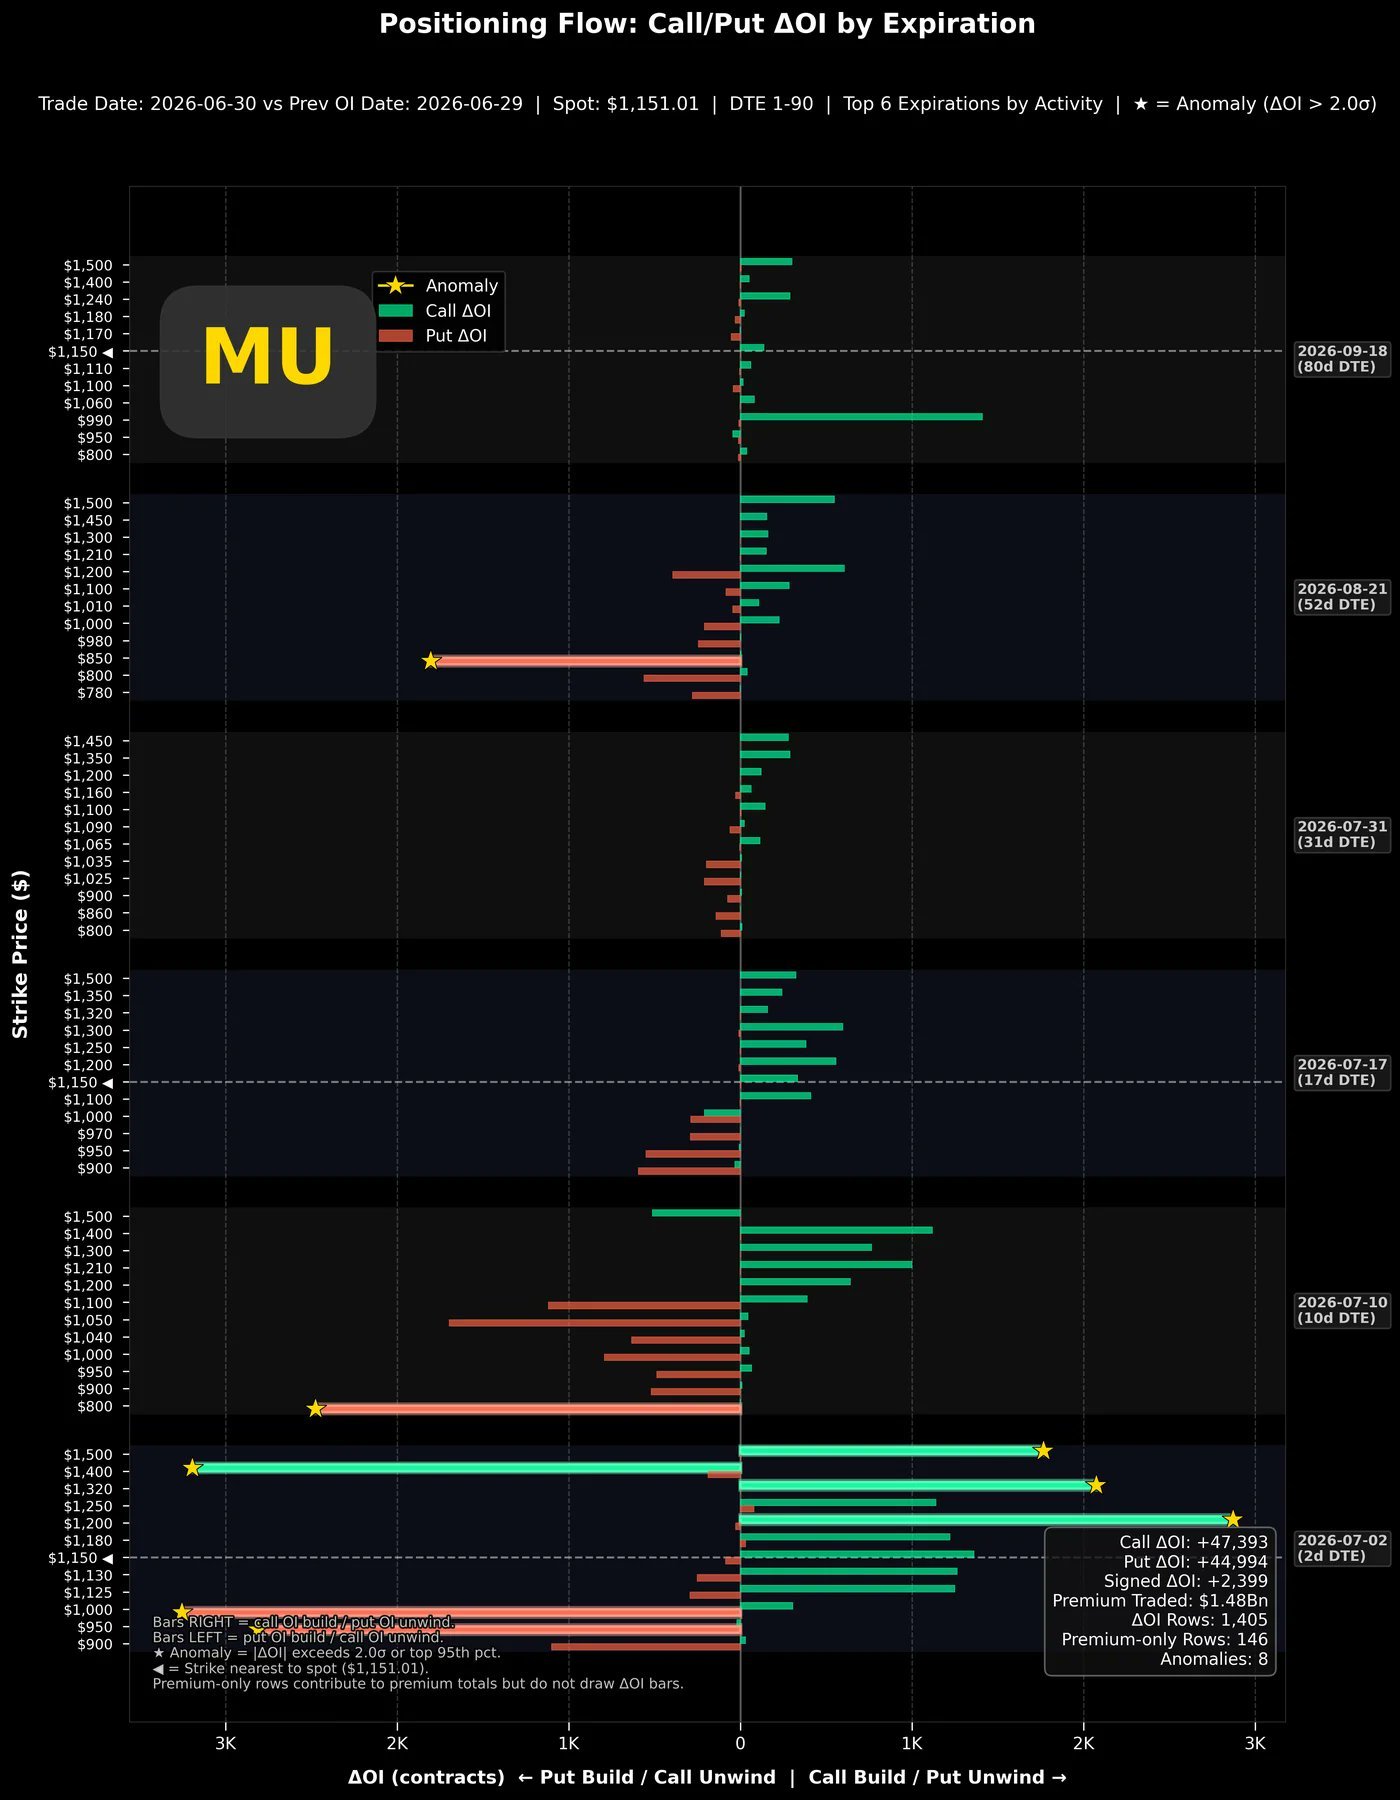
Looking at the single-day options position change chart, both sides are actively building positions. It's not yet clear which side will win, except for the nearest expiration, where other expirations might have slightly more put options.
Summary: The volatility spread continues to rise, the correlation coefficient has bottomed out first, the stock price is still consolidating but 有望 to complete near highs, similar to the box oscillation from February to April this year.
The copyright of this article belongs to the original author/organization.
The views expressed herein are solely those of the author and do not reflect the stance of the platform. The content is intended for investment reference purposes only and shall not be considered as investment advice. Please contact us if you have any questions or suggestions regarding the content services provided by the platform.
